PRODUCT AND SERVICE CATALOGUE

Make your factory visible, one module at a time.

Tuna Industrial Platform is a modular smart-factory platform that runs from the machine on the shop floor to the management report. Each module is activated on its own and works with the others on the same data.

Edition
2026 / v1
Modules
M01-M08
Web
catalog.tunaindustrial.com
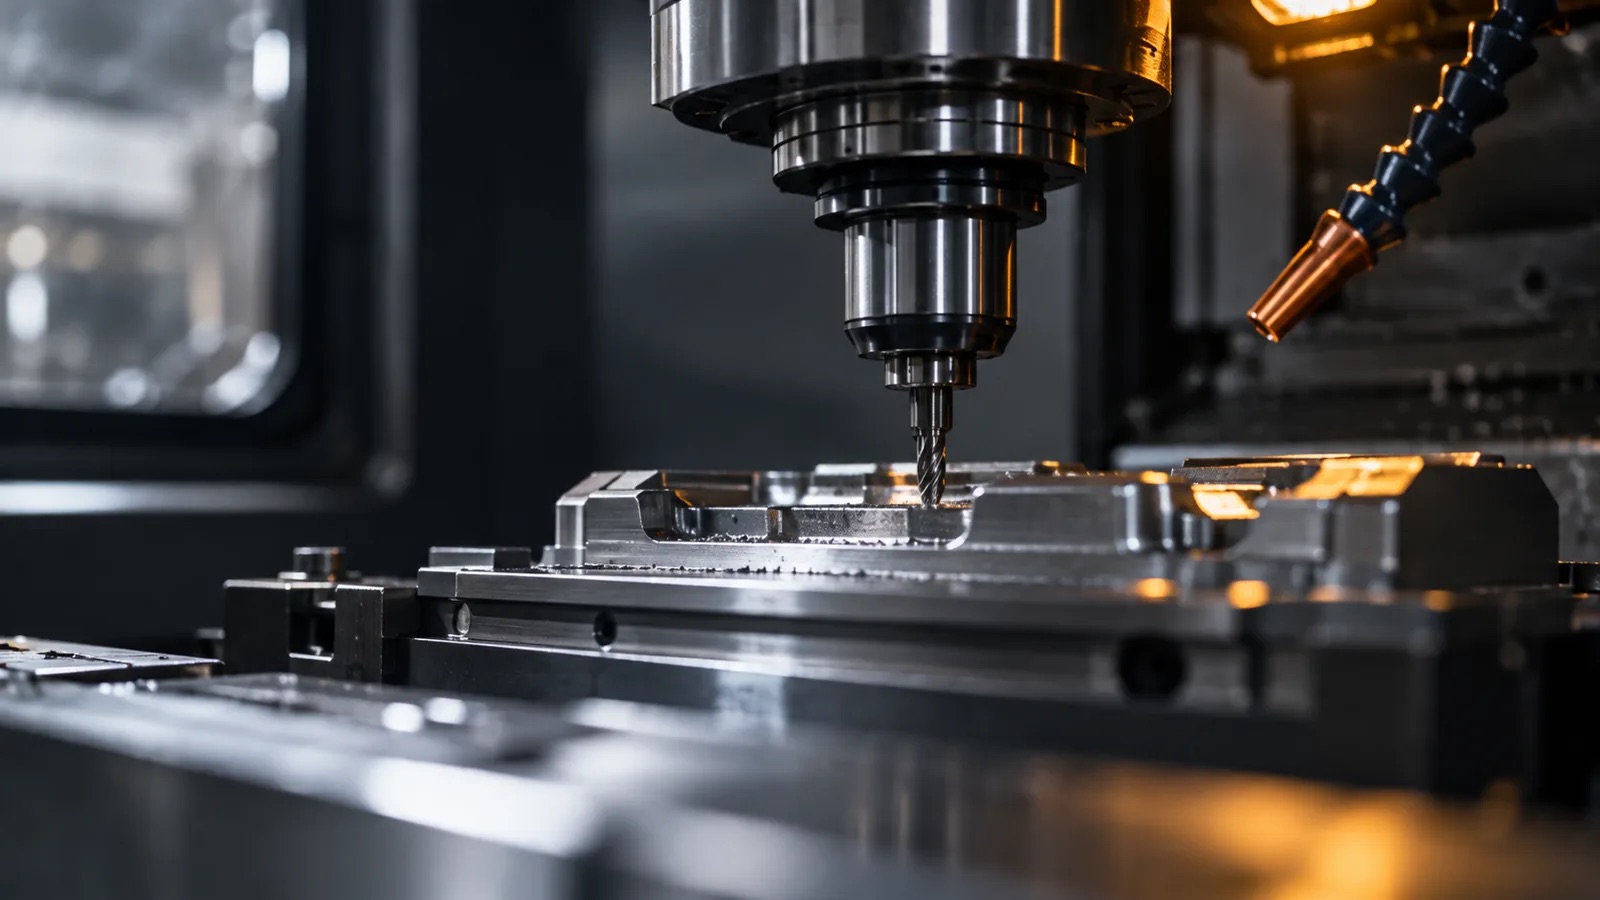
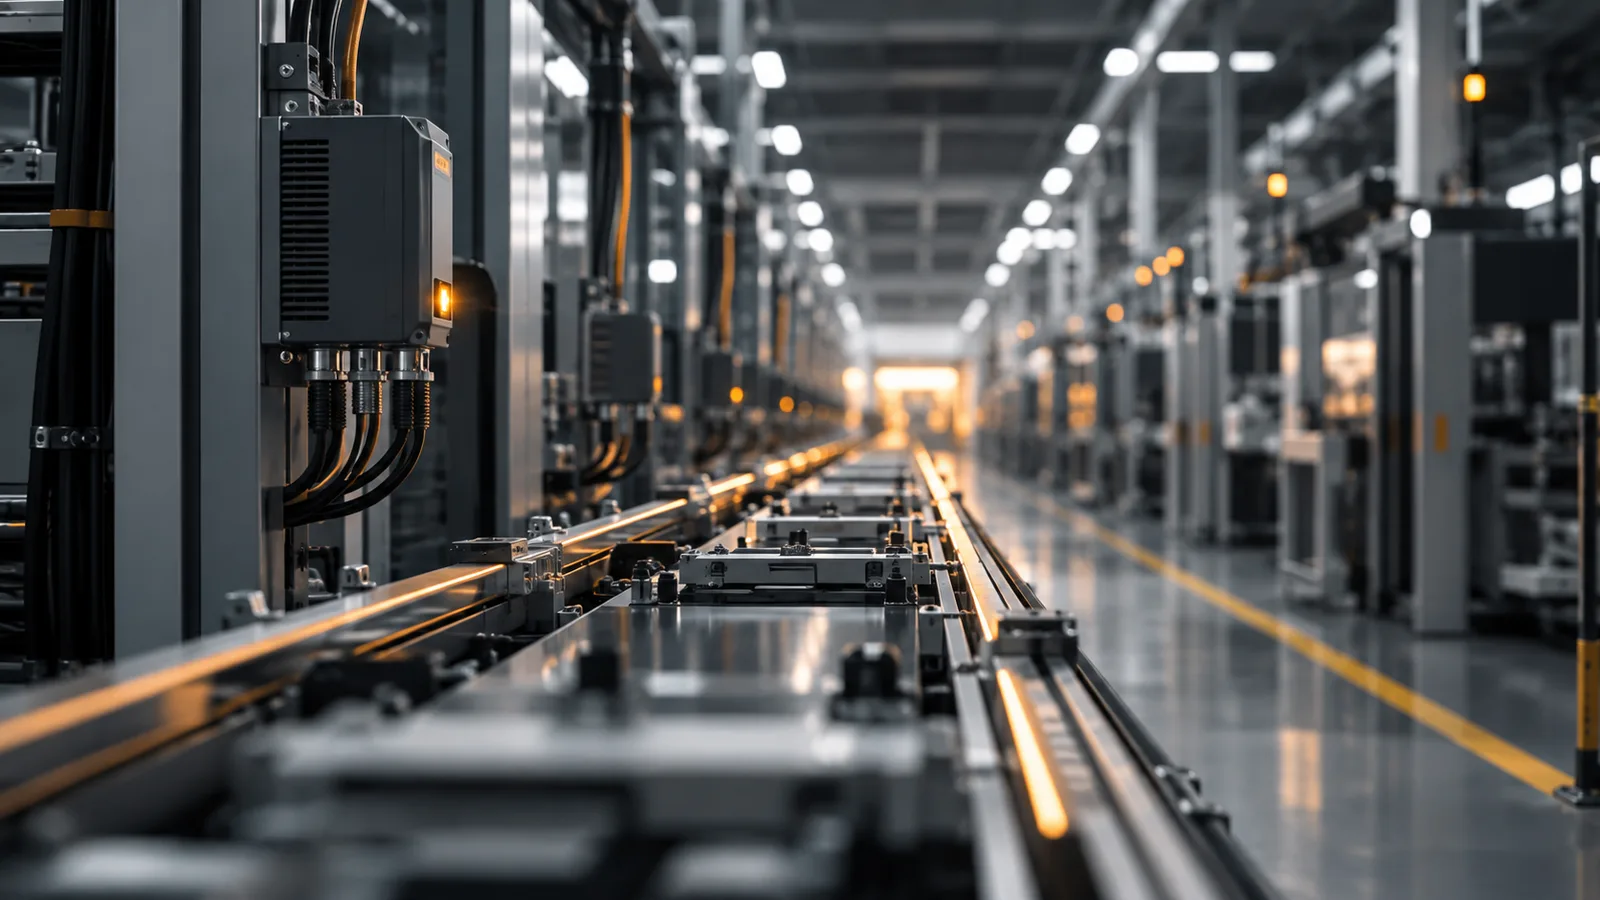
Representative factory imagery. Not a real customer installation.
THIS CATALOGUE

How to read it

The catalogue has two parts. Platform modules (M01-M08) describe what you will see in the factory. Services (S01-S04) describe how those modules are brought into your plant.

Each module page shows the layer it runs in, what it does, a typical question it answers, and the indicators it tracks. Figures in the dark boxes are simulated demo data.

WHERE TO START

Two starting points

Measure your plant’s digital maturity in a few minutes, or watch the modules in this catalogue running on simulated data.

THE 5 AREAS THE SCORE MEASURES
  1. 01Corporate Governance
  2. 02Customer & Market Management
  3. 03R&D Management
  4. 04Supply Management
  5. 05Production Management
START · ONLINE

Digital Transformation Score

Answer a short set of questions and get a maturity score across 5 areas with a roadmap tailored to you.

The score is generated automatically from your answers and is not a formal digital transformation audit.

Learn your score

START · TOGETHER

Live Factory Demo

We walk through the demo with you step by step, so you can see the modules in this catalogue working on one dashboard before any installation.

The demo runs on simulated factory data and is not a real customer installation.

Request the demo
CONTENTS
PLATFORM ARCHITECTURE

Not one large piece of software, but modules that connect.

Data is born on the shop floor, at the machine. Tuna Edge collects it and moves it into a common data model, where machines of different brands and protocols start speaking the same language.

The operations and management modules use that shared data. You start with what you need; every module you add reads the same data, so setup is never repeated from scratch.

PLATFORM MODULES

Eight modules, one shared dataset.

M01SHOP FLOOR

Tuna Edge

The connectivity layer that gets machine and PLC data safely off the shop floor.

Core layer
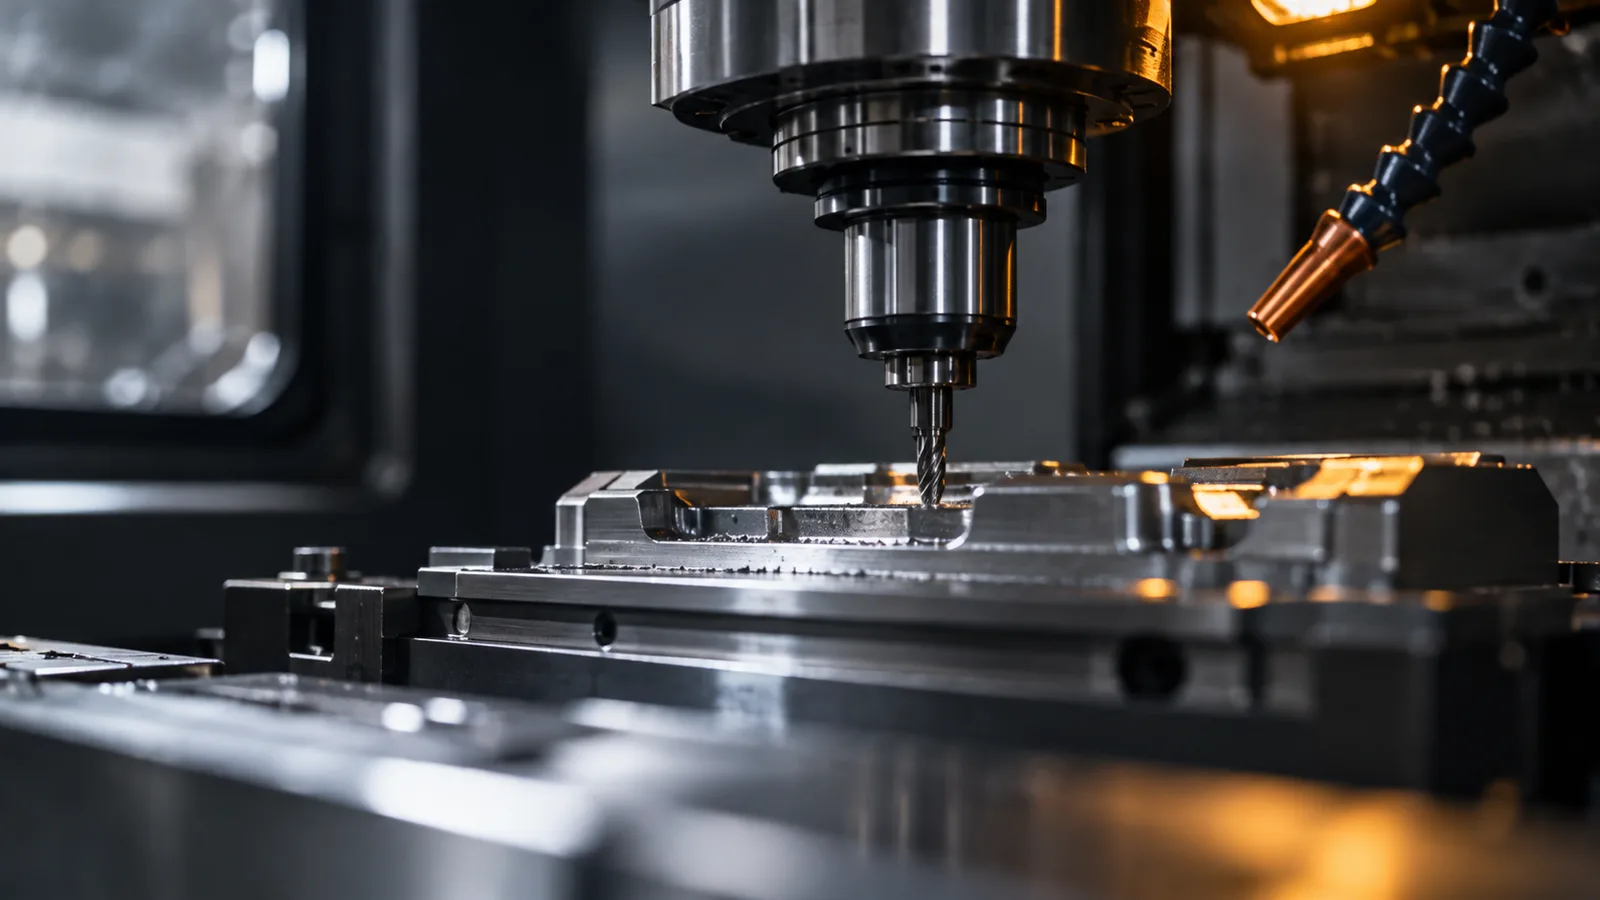
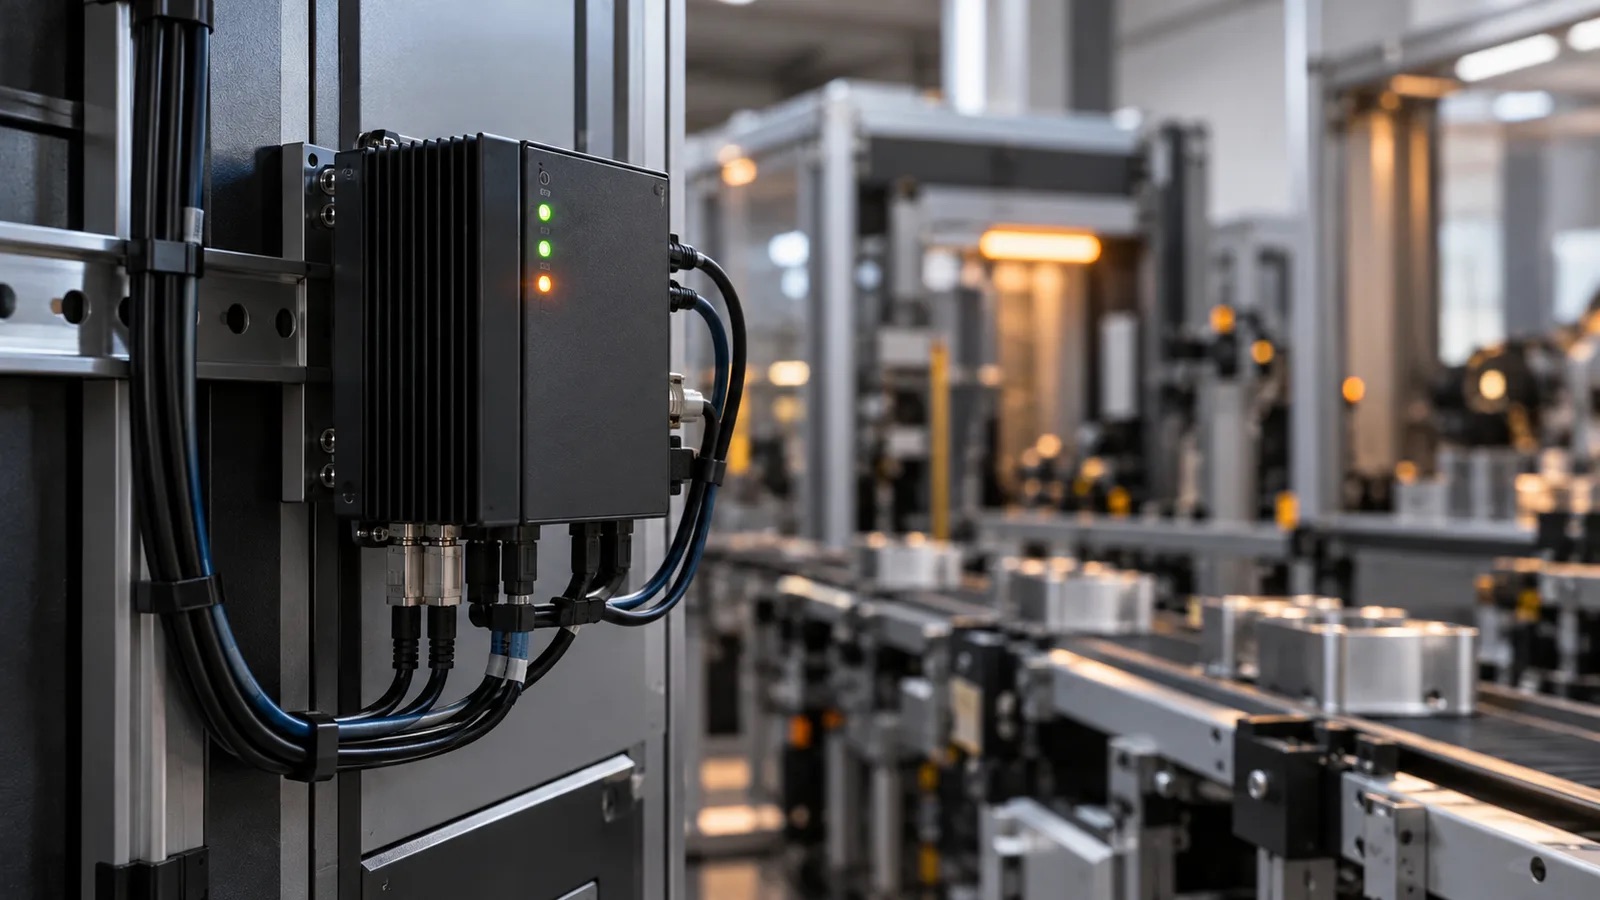
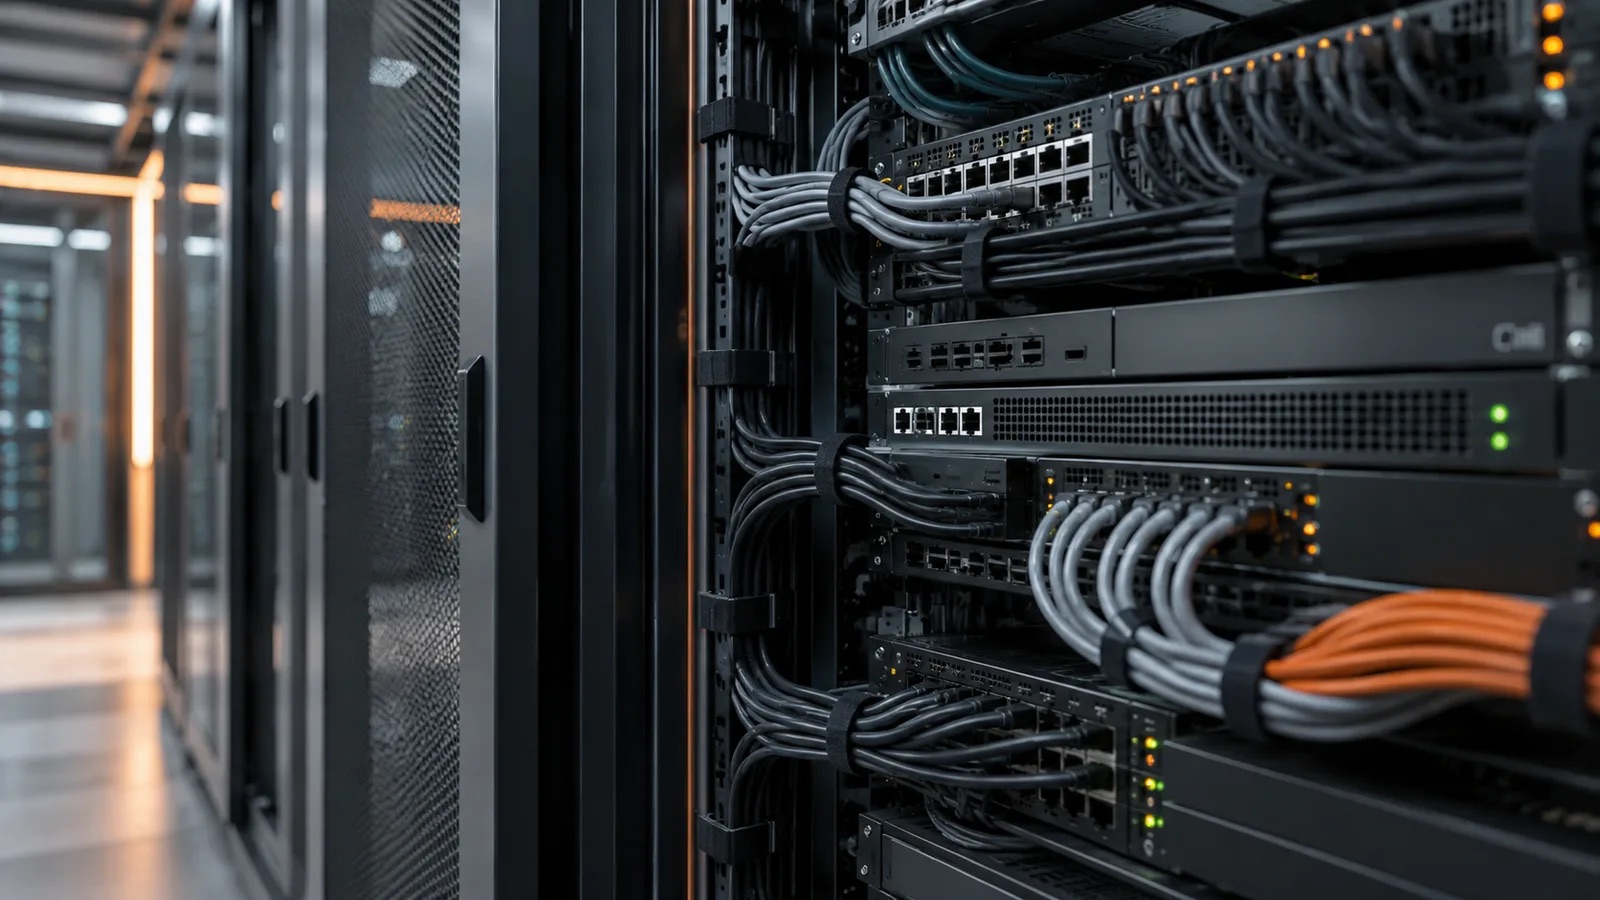
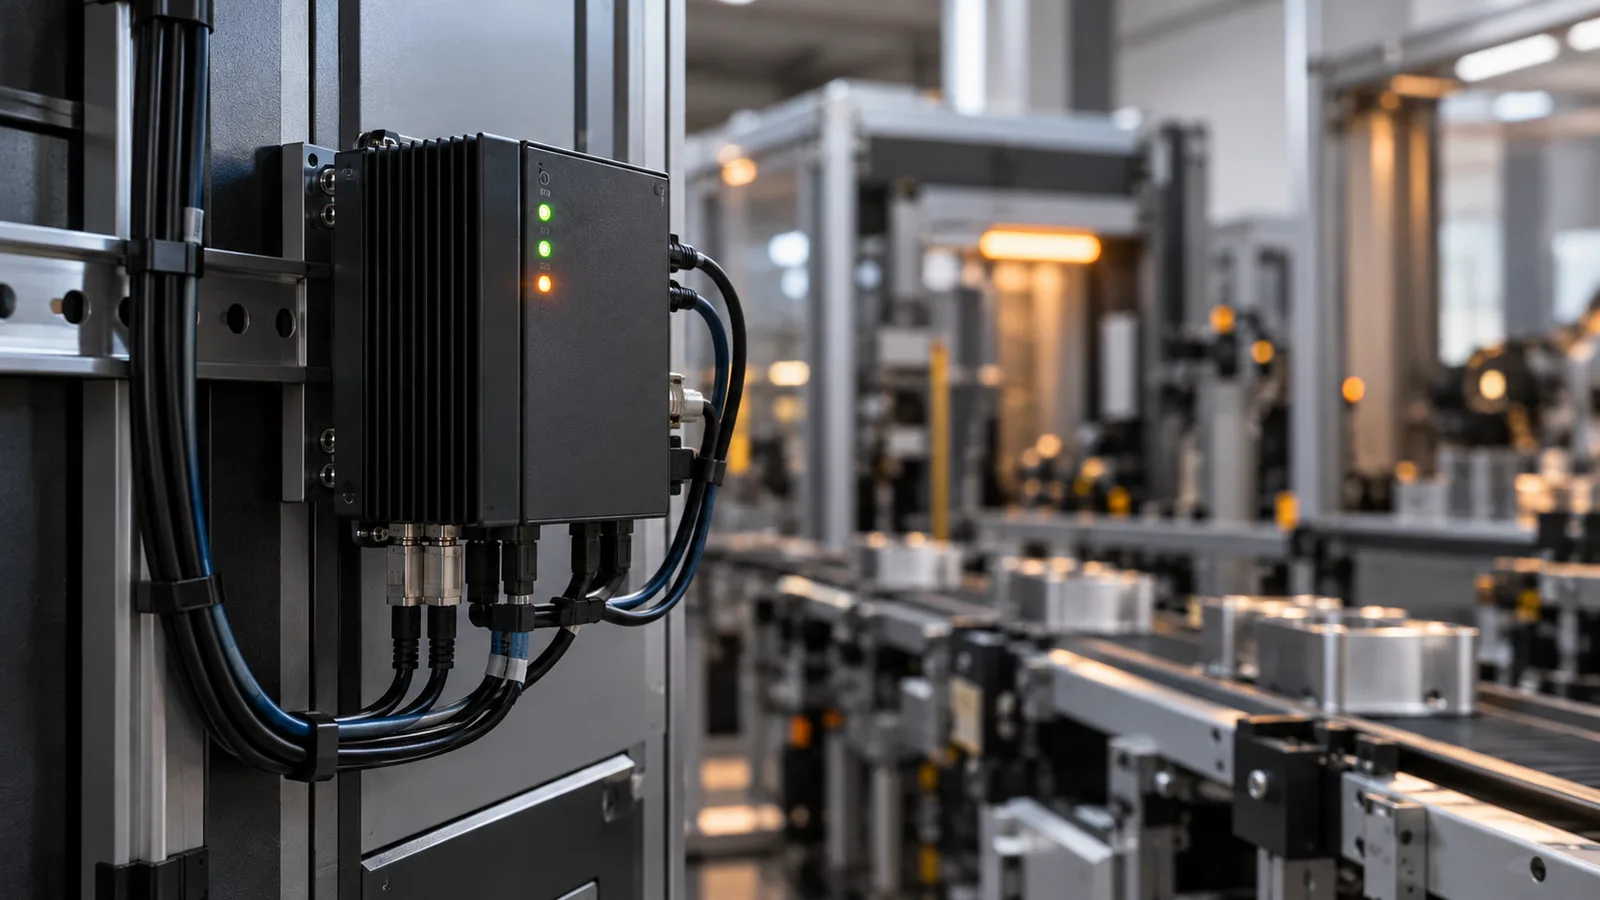
Representative factory imagery. Not a real customer installation.

Tuna Edge is a lightweight component that runs on the shop floor. It collects machine and PLC data and transmits it securely. When the connection drops it holds data locally, and when the connection returns it sends the backlog. Rather than rewriting low-level protocol stacks, it combines industrial connectivity methods already proven in the field, which shortens setup time and lowers risk.

WHAT IT DOES
01Collects machine and PLC data
02Transmits data securely
03Holds data locally when the connection drops
04Sends the backlog once the connection returns
QUESTION IT ANSWERS

“Which data can we get from which machine, and how?”

INDICATORS TRACKED
Connected machinesData continuityConnection status
CONNECTS TOEvery other module runs on the shop-floor data this layer collects.
See this module in the live demo
M02OPERATIONS

Visibility

Factory, line, and machine status on one screen, in real time.

Core module
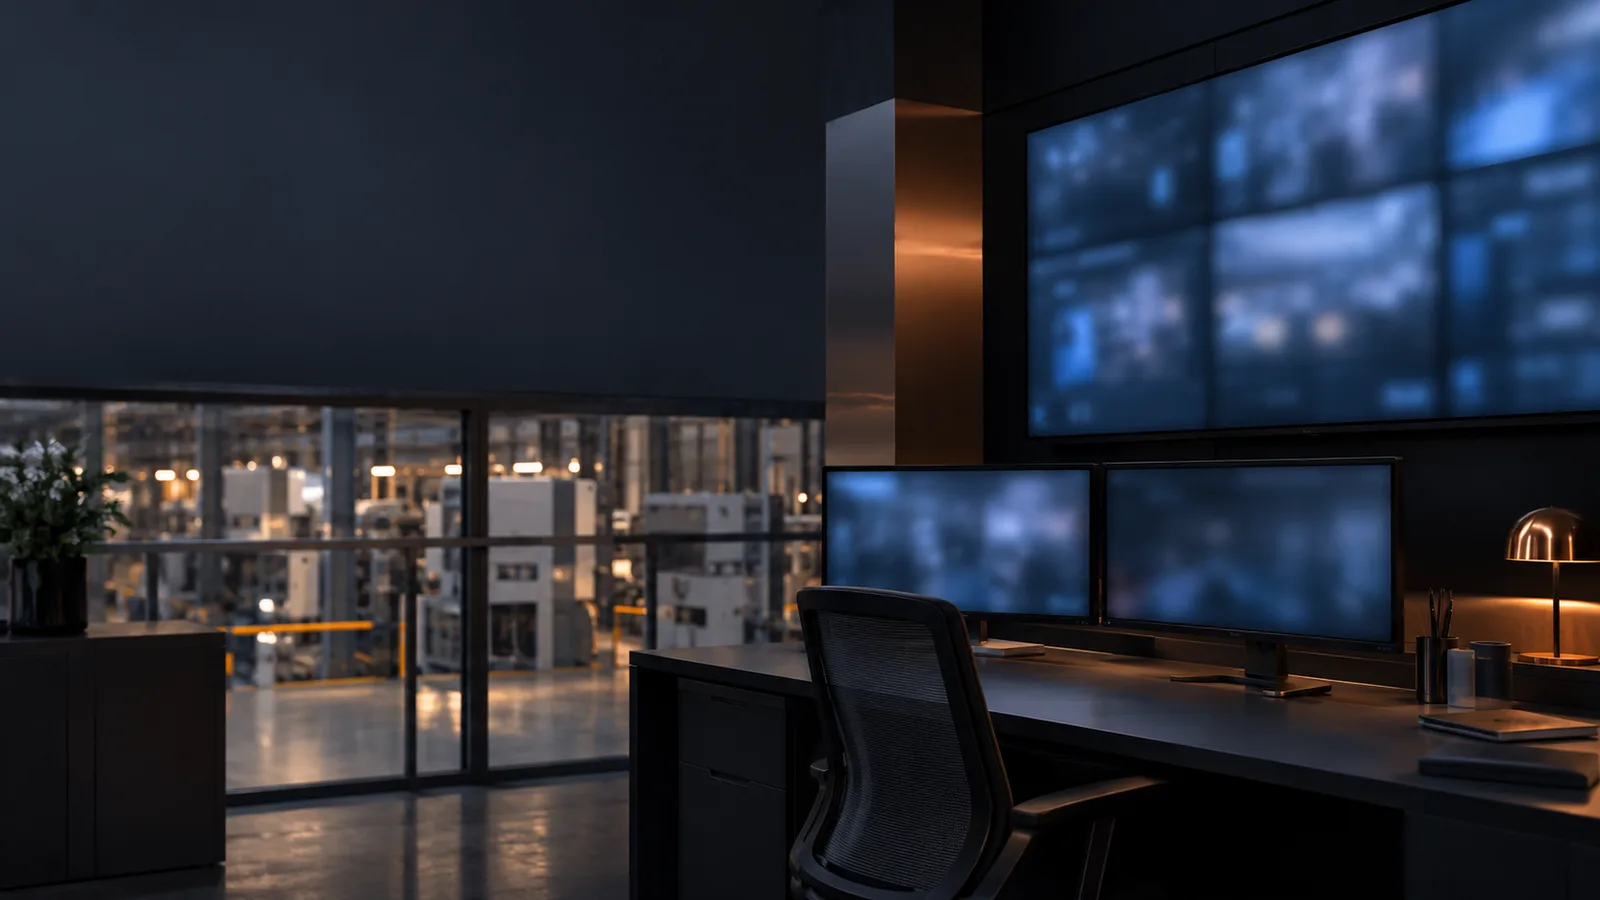
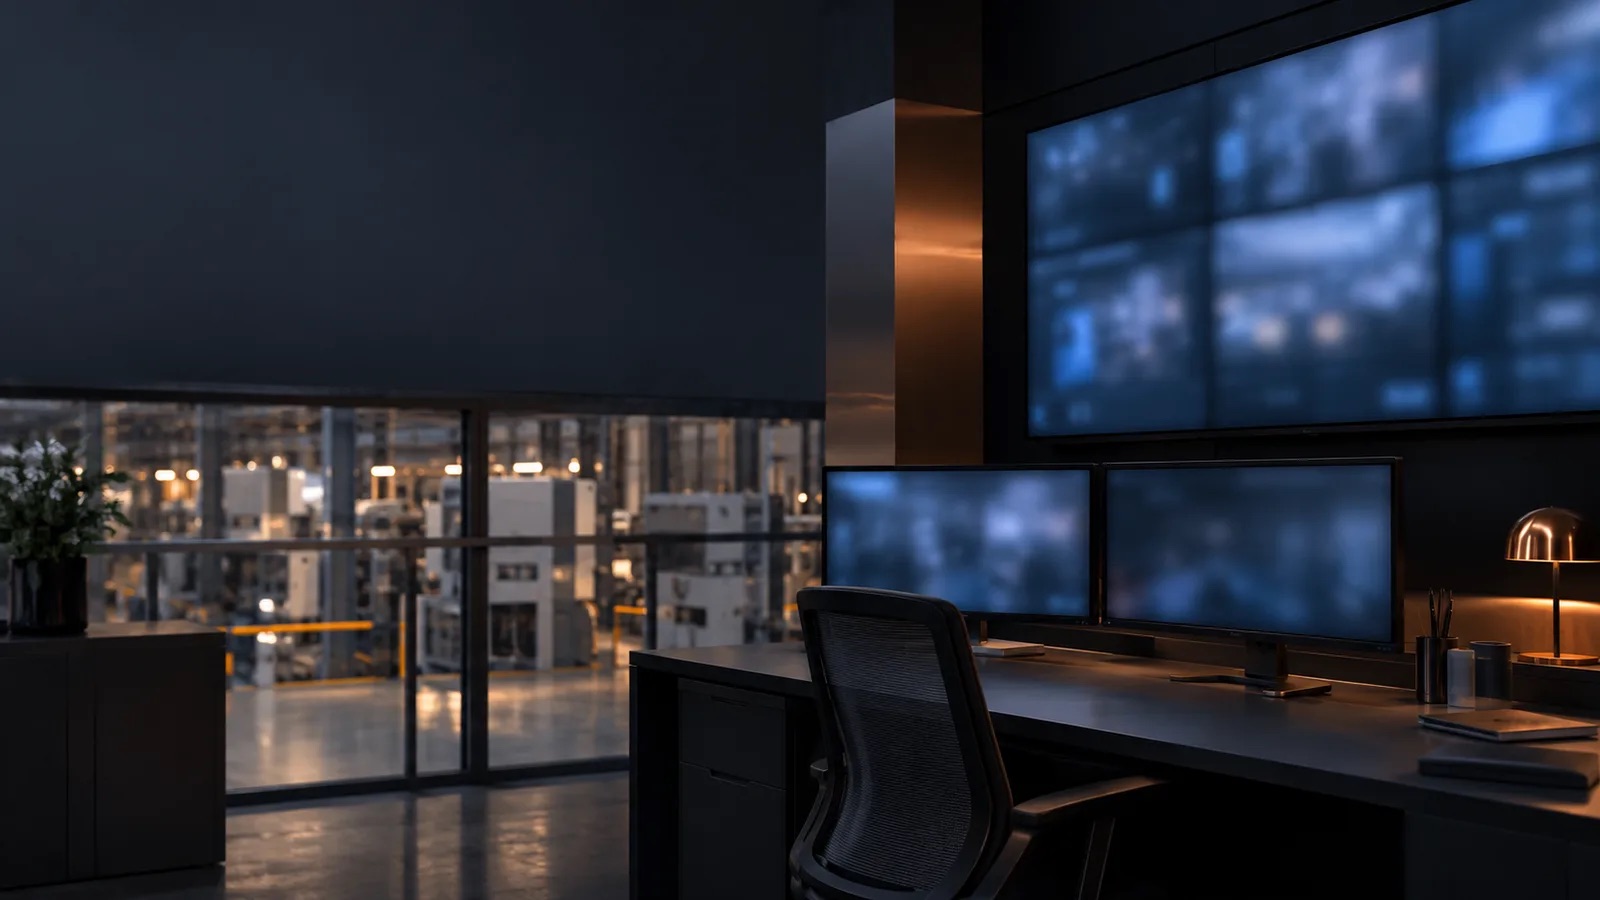
Representative factory imagery. Not a real customer installation.

You can see at a glance which machine is running and which has stopped, and drill down from the whole plant to a line and from a line to a single machine. Information that used to be collected by hand at the end of a shift is on screen during the shift.

WHAT IT DOES
01Plant, line, and machine overview
02Live running and stopped status
03OEE by line and by machine
04Alerts for critical conditions
QUESTION IT ANSWERS

“Which machine is running right now, and which has stopped?”

OEE · SHIFT 1SIMULATED
68%

Availability 86%, performance 82%, quality 96%. Their product comes out close to this value.

INDICATORS TRACKED
OEERunning / stopped machinesCritical alerts
CONNECTS TOFed by M01 Tuna Edge; provides the base data for M04 and M06.
See this module in the live demo
M03OPERATIONS

Plan vs. Actual

Places the production plan next to actual output.

Core module

Where and when the gap between target and result appears becomes something you can follow. Work order progress is tracked by day and shift, so you can see which line and which cause the shortfall came from.

WHAT IT DOES
01Plan compared with actual production
02Work order tracking and progress
03Target attainment by day and shift
04Time deviation per work order
QUESTION IT ANSWERS

“Why are we behind target today?”

TARGET ATTAINMENTSIMULATED
82%

82% of the shift target was reached. The largest gap came from the mould-change stop on line 2.

INDICATORS TRACKED
Target attainmentWork order completionTime deviation
CONNECTS TOTakes plan data from M07 ERP integration and actual output from M01 Tuna Edge.
See this module in the live demo
M04OPERATIONS

Loss Analysis

OEE, downtime, scrap, and quality in one place, with the source of loss visible.

Core module
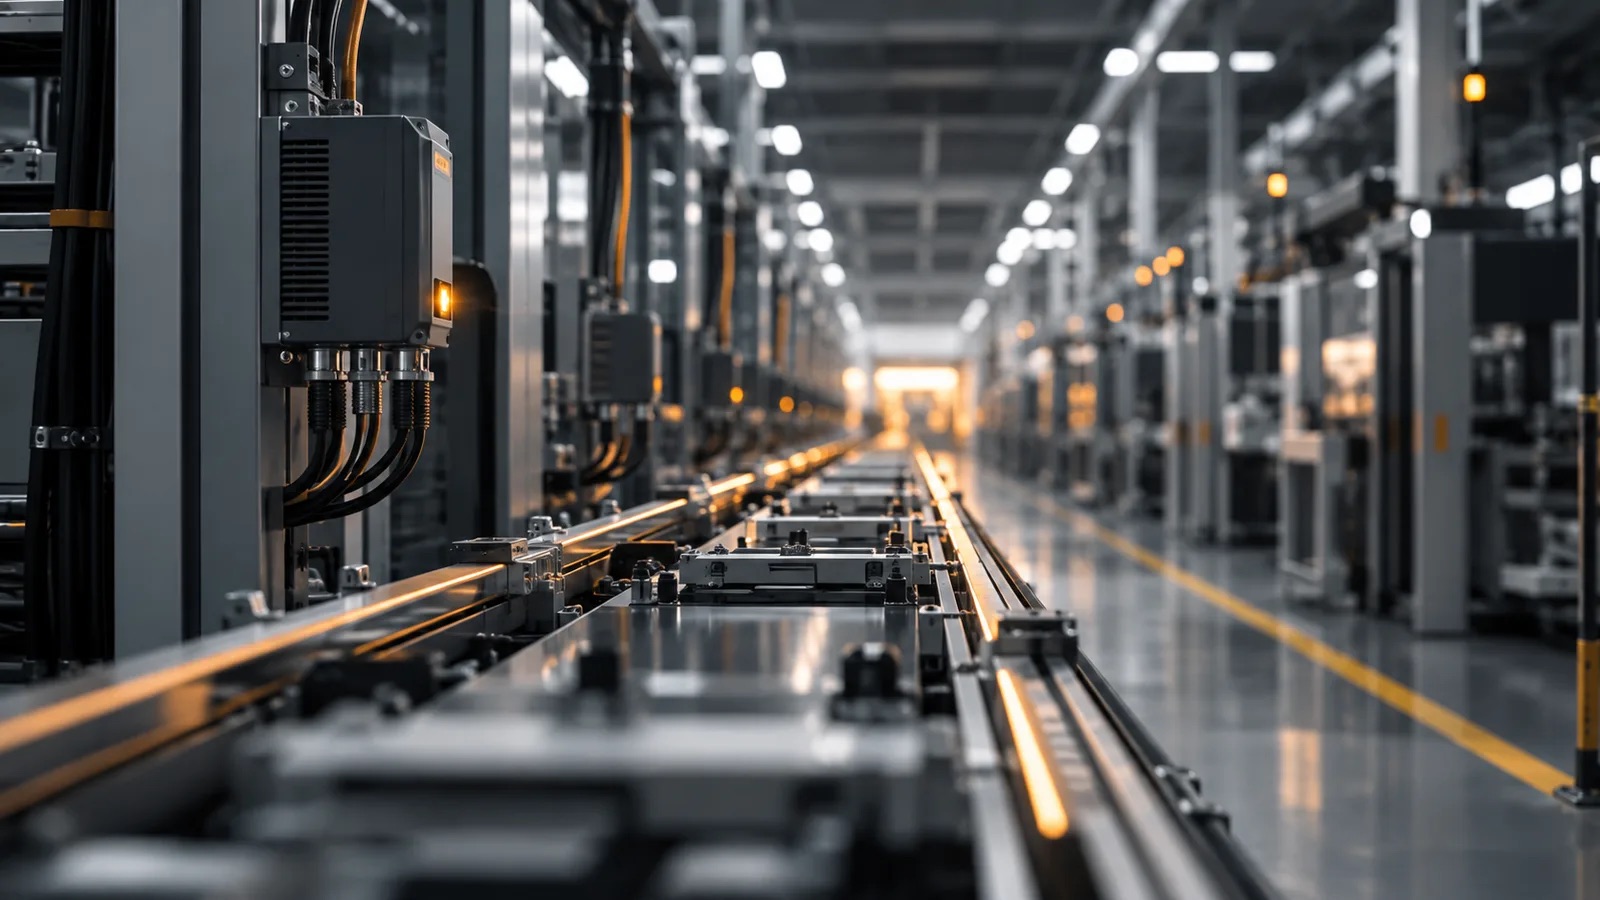
Representative factory imagery. Not a real customer installation.

Downtime and its causes are classified, and the causes behind the most loss are ranked. Scrap and quality results collect by product and by machine. The reason a machine stopped no longer depends on an operator’s memory.

WHAT IT DOES
01OEE and its components (availability, performance, quality)
02Downtime by cause and downtime Pareto
03Scrap rates by product and machine
04Breakdown by shift and machine
QUESTION IT ANSWERS

“Which machine caused the most loss, and why?”

LARGEST STOPSIMULATED
41 min

Mould change on Injection Press 2, followed by the warm-up wait.

INDICATORS TRACKED
OEEDowntime by causeScrap rateCycle time deviation
CONNECTS TOUses the same shop-floor data as M02 Visibility; results flow into M06 reports.
See this module in the live demo
M05OPERATIONS

Material Tracking

Material consumption is recorded and deviation from the recipe becomes visible.

Core module

Actual material consumption is compared with the standard recipe and shown with the size of the deviation. Where raw material, resin, or packaging is overused is broken down by product and work order.

WHAT IT DOES
01Recording of material consumption
02Comparison with the standard recipe
03Deviation per item
04Breakdown by product and work order
QUESTION IT ANSWERS

“On which item are we deviating from the recipe?”

MATERIAL DEVIATIONSIMULATED
3%

Actual consumption deviates 3% from the standard recipe, mostly on the main raw material.

INDICATORS TRACKED
Material deviationConsumption / recipe ratio
CONNECTS TOTakes recipe and stock data from M07 ERP integration.
See this module in the live demo
M06MANAGEMENT

Management Reporting

Shift, day, and period summaries at a glance.

Core module
Representative factory imagery. Not a real customer installation.

The management dashboard turns shop-floor data into something the decision maker can read. Summaries are produced by shift, day, and period; placing a line’s shifts side by side reveals the differences that keep repeating.

WHAT IT DOES
01Management dashboard
02Shift, day, and period summaries
03Shift comparison
04Traceability back to the underlying measurement
QUESTION IT ANSWERS

“What is different between shifts this week?”

SHIFT COMPARISONSIMULATED
3

Three shifts on the same line side by side: night shift downtime is twice that of the others.

INDICATORS TRACKED
OEE trendTarget attainmentDowntime and scrap summary
CONNECTS TOCombines the results of modules M02-M05 into one report.
See this module in the live demo
M07INTEGRATION

ERP Integration

You keep your existing ERP; the platform exchanges data with it.

Core module
Representative factory imagery. Not a real customer installation.

Tuna Industrial Platform is designed to integrate with ERP systems such as Logo, Netsis, SAP, and ERPNext. The goal is not to replace your enterprise system but to talk to it. The shop-floor visibility and production intelligence layer sits on top of your current system; you never have to give up a working ERP.

WHAT IT DOES
01Integration with Logo, Netsis, SAP, ERPNext and similar
02Work order, plan, and recipe data brought to the floor
03Shop-floor results returned to the enterprise system
04Existing processes kept in place
QUESTION IT ANSWERS

“Where is this ERP work order on the floor right now?”

INDICATORS TRACKED
Synchronised work ordersData freshness
CONNECTS TOSupplies plan and recipe data for M03 and M05.
See this module in the live demo
M08INTELLIGENCE

Tuna Intelligence

The AI layer that answers production questions from factory data.

Later stage, introduced gradually

Tuna Intelligence aims to answer questions such as why the day is behind target, which machine caused the most loss, or which product has the highest scrap rate, using actual factory data. It is introduced in stages rather than all at once, and every answer is designed to be traceable back to the measurement it rests on.

WHAT IT DOES
01Production questions in plain language
02Answers grounded in factory data
03Every answer traceable to its source
04Introduced in stages
QUESTION IT ANSWERS

“Which product has the highest scrap rate, and why?”

SAMPLE ANSWER · SCRAPSIMULATED
7%

Clear lid (TP-140) is highest at 7% scrap against a 4% line average. Likely cause: flash on the first shots taken while the mould was still cold.

INDICATORS TRACKED
Underlying measurementSource trace
CONNECTS TORuns on the shared data of all other modules; added to the same platform at a later stage.
See this module in the live demo
INDUSTRY SOLUTIONS

Which modules matter in which industry

Five manufacturing scenarios, derived from sector patterns that recur across the DDX evidence base. The table shows the modules that lead in each scenario and the example indicators tracked.

Food ProductionBatch and lot traceability by hand, downtime on paper, scrap not visible in real time.
OEE · scrap rate · downtime by cause · material deviation
Plastics and CompositesCycle time drift goes unnoticed, setups run long, resin consumption deviates.
Performance (cycle drift) · setup time · material deviation
CNC and MetalworkingDowntime causes live in operators’ memory; efficiency cannot be compared per work order.
Availability · downtime Pareto · work order completion
Machine BuildingWork order progress is invisible on long processes; cost and performance per project are poorly tracked.
Production completion · time deviation per work order
General Discrete ManufacturingNo central view of which line or machine is in which state.
OEE · running / stopped machines · critical alerts
CNC and Metalworking

Downtime causes live in operators’ memory; efficiency cannot be compared per work order.

Availability · downtime Pareto · work order completion
Machine Building

Work order progress is invisible on long processes; cost and performance per project are poorly tracked.

Production completion · time deviation per work order
M01 Tuna Edge is the common foundation of every scenario where machine data is collected.These are representative scenarios derived from DDX evidence, not real customer case studies.

Beyond manufacturing: the same approach, other operations

Field ServiceVisibility of field technicians and service teams: first-time fix rate, SLA breach risk, travel and waiting inefficiency, spare-part use.
LogisticsFleet and route visibility: delivery success rate, delay causes, fuel consumption and deviation tracking.
Sales and MarketingSales team and pipeline visibility: quota attainment, loss-reason analysis, campaign spend deviation.
These three modules are a demo running on simulated data and, unlike the manufacturing scenarios, are not derived from DDX evidence.
SERVICES

Four steps from assessment to a working factory

Our method starts with an independent DDX assessment, takes shape in a Solution Blueprint within 48-72 hours, and reaches the shop floor through a narrowly scoped pilot. Once the pilot succeeds, it grows on the same platform.

S01INDEPENDENT

DDX assessment

DDX is an independently run digital maturity assessment. It sets out the current state, the priority problems, and the target state.

OUTPUT Current state and priorities. Not a software specification.
S0248-72 HOURS

Solution Blueprint

The DDX output becomes a concrete document showing which modules are activated, with which integrations, which pilot scope, and on what timeline.

OUTPUT Module selection, integrations, pilot scope, timeline.
S031 AREA · 3-10 MACHINES

Narrow pilot

One production area, 3-10 machines, and a limited number of users. It can start soon after discovery and the connectivity review; the exact timing is set after discovery.

OUTPUT Modules running on the floor, with measurable success criteria.
S04SAME PLATFORM

Scale-up

Once the pilot criteria are met, scope extends to new lines, added capabilities such as quality and maintenance, or other plants. No setup from scratch.

OUTPUT New lines, new modules, new plants.

The DDX recommendation and the Tuna Industrial Platform commercial proposal are separate, traceable documents. Keeping them apart protects the independence of the assessment.

CONTACT

Making your factory visible starts with one assessment.

Tell us about your plant and what you want to improve. We will reply with the modules and pilot scope that fit your situation.

TURKEYTuna Project Global Ticaret A.Ş.Fuat Edip Baksı Mah. Anadolu Cad. No: 175/1 D:13, 35540 Bayraklı / İzmir+90 232 335 25 15info@tunaindustrial.com
UNITED STATESTuna Project LLC7901 4th St. N #16745, St. Petersburg, FL 33702, USA+1 908 444 6 888office@tunaindustrial.com
Figures in this catalogue are simulated demo data and do not represent a real customer result. Images are representative.Industry scenarios are representative examples derived from DDX evidence. Security controls are designed, not yet implemented.This catalogue is for information only and contains no pricing. Scope, timing, and commercial terms are defined in the Solution Blueprint.
© 2026 Tuna Industrial Platform · tunaindustrial.comcatalog.tunaindustrial.com · 2026 / v1
Digital score Live demo
Tuna Industrial PlatformCATALOGUE
2026 / v1
PRODUCT AND SERVICE CATALOGUE

Make your factory visible, one module at a time.

Tuna Industrial Platform is a modular smart-factory platform that runs from the machine on the shop floor to the management report. Each module is activated on its own and works with the others on the same data.

Representative factory imagery. Not a real customer installation.
Edition
2026 / v1
Modules
M01-M08
Web
catalog.tunaindustrial.com
WHERE TO START
Digital Transformation Scoretunaindustrial.com/en/digital-score
Tuna Industrial Platform · 2026 / v101 / 15
Product and Service Cataloguecatalog.tunaindustrial.com
THIS CATALOGUE

How to read it

The catalogue has two parts. Platform modules (M01-M08) describe what you will see in the factory. Services (S01-S04) describe how those modules are brought into your plant.

Each module page shows the layer it runs in, what it does, a typical question it answers, and the indicators it tracks. Figures in the dark boxes are simulated demo data.

CONTENTS
00Platform architecturePlatform03
M01Tuna EdgeSHOP FLOOR04
M02VisibilityOPERATIONS05
M03Plan vs. ActualOPERATIONS06
M04Loss AnalysisOPERATIONS07
M05Material TrackingOPERATIONS08
M06Management ReportingMANAGEMENT09
M07ERP IntegrationINTEGRATION10
M08Tuna IntelligenceINTELLIGENCE11
09Industry solutionsIndustries12
10Services and methodServices13
11Two starting pointsStart14
12ContactContact15
Tuna Industrial Platform · 2026 / v102 / 15
Product and Service Cataloguecatalog.tunaindustrial.com
PLATFORM ARCHITECTURE

Not one large piece of software, but modules that connect.

Data is born on the shop floor, at the machine. Tuna Edge collects it and moves it into a common data model, where machines of different brands and protocols start speaking the same language.

The operations and management modules use that shared data. You start with what you need; every module you add reads the same data, so setup is never repeated from scratch.

L4Intelligence
Data flow: shop floor → Edge → common data model → modules → Tuna Intelligence
M07You keep your existing ERPThe platform does not replace your ERP. It exchanges data with it.
LogoNetsisSAPERPNext
Tuna Industrial Platform · 2026 / v103 / 15
Product and Service Cataloguecatalog.tunaindustrial.com
M01SHOP FLOOR
Core layer

Tuna Edge

The connectivity layer that gets machine and PLC data safely off the shop floor.

Representative factory imagery. Not a real customer installation.

Tuna Edge is a lightweight component that runs on the shop floor. It collects machine and PLC data and transmits it securely. When the connection drops it holds data locally, and when the connection returns it sends the backlog. Rather than rewriting low-level protocol stacks, it combines industrial connectivity methods already proven in the field, which shortens setup time and lowers risk.

WHAT IT DOES
01Collects machine and PLC data
02Transmits data securely
03Holds data locally when the connection drops
04Sends the backlog once the connection returns
QUESTION IT ANSWERS

“Which data can we get from which machine, and how?”

INDICATORS TRACKED
Connected machinesData continuityConnection status
CONNECTS TOEvery other module runs on the shop-floor data this layer collects.
WHERE IT SITS
L4 IntelligenceM08
L3 ManagementM06
L2 OperationsM02M03M04M05
L1 DataCommon data modelM01
L0 Shop floorMachines · PLC · Sensors
ERPM07Logo · Netsis · SAP · ERPNext
START · TOGETHERSee this module in the live demoThe demo runs on simulated factory data and is not a real customer installation.
Tuna Industrial Platform · 2026 / v104 / 15
Product and Service Cataloguecatalog.tunaindustrial.com
M02OPERATIONS
Core module

Visibility

Factory, line, and machine status on one screen, in real time.

OEE · SHIFT 1SIMULATED
68%

Availability 86%, performance 82%, quality 96%. Their product comes out close to this value.

Representative factory imagery. Not a real customer installation.

You can see at a glance which machine is running and which has stopped, and drill down from the whole plant to a line and from a line to a single machine. Information that used to be collected by hand at the end of a shift is on screen during the shift.

WHAT IT DOES
01Plant, line, and machine overview
02Live running and stopped status
03OEE by line and by machine
04Alerts for critical conditions
QUESTION IT ANSWERS

“Which machine is running right now, and which has stopped?”

INDICATORS TRACKED
OEERunning / stopped machinesCritical alerts
CONNECTS TOFed by M01 Tuna Edge; provides the base data for M04 and M06.
WHERE IT SITS
L4 IntelligenceM08
L3 ManagementM06
L2 OperationsM02M03M04M05
L1 DataCommon data modelM01
L0 Shop floorMachines · PLC · Sensors
ERPM07Logo · Netsis · SAP · ERPNext
START · TOGETHERSee this module in the live demoThe demo runs on simulated factory data and is not a real customer installation.
Tuna Industrial Platform · 2026 / v105 / 15
Product and Service Cataloguecatalog.tunaindustrial.com
M03OPERATIONS
Core module

Plan vs. Actual

Places the production plan next to actual output.

TARGET ATTAINMENTSIMULATED
82%

82% of the shift target was reached. The largest gap came from the mould-change stop on line 2.

Where and when the gap between target and result appears becomes something you can follow. Work order progress is tracked by day and shift, so you can see which line and which cause the shortfall came from.

WHAT IT DOES
01Plan compared with actual production
02Work order tracking and progress
03Target attainment by day and shift
04Time deviation per work order
QUESTION IT ANSWERS

“Why are we behind target today?”

INDICATORS TRACKED
Target attainmentWork order completionTime deviation
CONNECTS TOTakes plan data from M07 ERP integration and actual output from M01 Tuna Edge.
WHERE IT SITS
L4 IntelligenceM08
L3 ManagementM06
L2 OperationsM02M03M04M05
L1 DataCommon data modelM01
L0 Shop floorMachines · PLC · Sensors
ERPM07Logo · Netsis · SAP · ERPNext
START · TOGETHERSee this module in the live demoThe demo runs on simulated factory data and is not a real customer installation.
Tuna Industrial Platform · 2026 / v106 / 15
Product and Service Cataloguecatalog.tunaindustrial.com
M04OPERATIONS
Core module

Loss Analysis

OEE, downtime, scrap, and quality in one place, with the source of loss visible.

LARGEST STOPSIMULATED
41 min

Mould change on Injection Press 2, followed by the warm-up wait.

Representative factory imagery. Not a real customer installation.

Downtime and its causes are classified, and the causes behind the most loss are ranked. Scrap and quality results collect by product and by machine. The reason a machine stopped no longer depends on an operator’s memory.

WHAT IT DOES
01OEE and its components (availability, performance, quality)
02Downtime by cause and downtime Pareto
03Scrap rates by product and machine
04Breakdown by shift and machine
QUESTION IT ANSWERS

“Which machine caused the most loss, and why?”

INDICATORS TRACKED
OEEDowntime by causeScrap rateCycle time deviation
CONNECTS TOUses the same shop-floor data as M02 Visibility; results flow into M06 reports.
WHERE IT SITS
L4 IntelligenceM08
L3 ManagementM06
L2 OperationsM02M03M04M05
L1 DataCommon data modelM01
L0 Shop floorMachines · PLC · Sensors
ERPM07Logo · Netsis · SAP · ERPNext
START · TOGETHERSee this module in the live demoThe demo runs on simulated factory data and is not a real customer installation.
Tuna Industrial Platform · 2026 / v107 / 15
Product and Service Cataloguecatalog.tunaindustrial.com
M05OPERATIONS
Core module

Material Tracking

Material consumption is recorded and deviation from the recipe becomes visible.

MATERIAL DEVIATIONSIMULATED
3%

Actual consumption deviates 3% from the standard recipe, mostly on the main raw material.

Actual material consumption is compared with the standard recipe and shown with the size of the deviation. Where raw material, resin, or packaging is overused is broken down by product and work order.

WHAT IT DOES
01Recording of material consumption
02Comparison with the standard recipe
03Deviation per item
04Breakdown by product and work order
QUESTION IT ANSWERS

“On which item are we deviating from the recipe?”

INDICATORS TRACKED
Material deviationConsumption / recipe ratio
CONNECTS TOTakes recipe and stock data from M07 ERP integration.
WHERE IT SITS
L4 IntelligenceM08
L3 ManagementM06
L2 OperationsM02M03M04M05
L1 DataCommon data modelM01
L0 Shop floorMachines · PLC · Sensors
ERPM07Logo · Netsis · SAP · ERPNext
START · TOGETHERSee this module in the live demoThe demo runs on simulated factory data and is not a real customer installation.
Tuna Industrial Platform · 2026 / v108 / 15
Product and Service Cataloguecatalog.tunaindustrial.com
M06MANAGEMENT
Core module

Management Reporting

Shift, day, and period summaries at a glance.

SHIFT COMPARISONSIMULATED
3

Three shifts on the same line side by side: night shift downtime is twice that of the others.

Representative factory imagery. Not a real customer installation.

The management dashboard turns shop-floor data into something the decision maker can read. Summaries are produced by shift, day, and period; placing a line’s shifts side by side reveals the differences that keep repeating.

WHAT IT DOES
01Management dashboard
02Shift, day, and period summaries
03Shift comparison
04Traceability back to the underlying measurement
QUESTION IT ANSWERS

“What is different between shifts this week?”

INDICATORS TRACKED
OEE trendTarget attainmentDowntime and scrap summary
CONNECTS TOCombines the results of modules M02-M05 into one report.
WHERE IT SITS
L4 IntelligenceM08
L3 ManagementM06
L2 OperationsM02M03M04M05
L1 DataCommon data modelM01
L0 Shop floorMachines · PLC · Sensors
ERPM07Logo · Netsis · SAP · ERPNext
START · TOGETHERSee this module in the live demoThe demo runs on simulated factory data and is not a real customer installation.
Tuna Industrial Platform · 2026 / v109 / 15
Product and Service Cataloguecatalog.tunaindustrial.com
M07INTEGRATION
Core module

ERP Integration

You keep your existing ERP; the platform exchanges data with it.

Representative factory imagery. Not a real customer installation.

Tuna Industrial Platform is designed to integrate with ERP systems such as Logo, Netsis, SAP, and ERPNext. The goal is not to replace your enterprise system but to talk to it. The shop-floor visibility and production intelligence layer sits on top of your current system; you never have to give up a working ERP.

WHAT IT DOES
01Integration with Logo, Netsis, SAP, ERPNext and similar
02Work order, plan, and recipe data brought to the floor
03Shop-floor results returned to the enterprise system
04Existing processes kept in place
QUESTION IT ANSWERS

“Where is this ERP work order on the floor right now?”

INDICATORS TRACKED
Synchronised work ordersData freshness
CONNECTS TOSupplies plan and recipe data for M03 and M05.
WHERE IT SITS
L4 IntelligenceM08
L3 ManagementM06
L2 OperationsM02M03M04M05
L1 DataCommon data modelM01
L0 Shop floorMachines · PLC · Sensors
ERPM07Logo · Netsis · SAP · ERPNext
START · TOGETHERSee this module in the live demoThe demo runs on simulated factory data and is not a real customer installation.
Tuna Industrial Platform · 2026 / v110 / 15
Product and Service Cataloguecatalog.tunaindustrial.com
M08INTELLIGENCE
Later stage, introduced gradually

Tuna Intelligence

The AI layer that answers production questions from factory data.

SAMPLE ANSWER · SCRAPSIMULATED
7%

Clear lid (TP-140) is highest at 7% scrap against a 4% line average. Likely cause: flash on the first shots taken while the mould was still cold.

Tuna Intelligence aims to answer questions such as why the day is behind target, which machine caused the most loss, or which product has the highest scrap rate, using actual factory data. It is introduced in stages rather than all at once, and every answer is designed to be traceable back to the measurement it rests on.

WHAT IT DOES
01Production questions in plain language
02Answers grounded in factory data
03Every answer traceable to its source
04Introduced in stages
QUESTION IT ANSWERS

“Which product has the highest scrap rate, and why?”

INDICATORS TRACKED
Underlying measurementSource trace
CONNECTS TORuns on the shared data of all other modules; added to the same platform at a later stage.
WHERE IT SITS
L4 IntelligenceM08
L3 ManagementM06
L2 OperationsM02M03M04M05
L1 DataCommon data modelM01
L0 Shop floorMachines · PLC · Sensors
ERPM07Logo · Netsis · SAP · ERPNext
START · TOGETHERSee this module in the live demoThe demo runs on simulated factory data and is not a real customer installation.
Tuna Industrial Platform · 2026 / v111 / 15
Product and Service Cataloguecatalog.tunaindustrial.com
INDUSTRY SOLUTIONS

Which modules matter in which industry

Five manufacturing scenarios, derived from sector patterns that recur across the DDX evidence base. The table shows the modules that lead in each scenario and the example indicators tracked.

Food ProductionBatch and lot traceability by hand, downtime on paper, scrap not visible in real time.
OEE · scrap rate · downtime by cause · material deviation
Plastics and CompositesCycle time drift goes unnoticed, setups run long, resin consumption deviates.
Performance (cycle drift) · setup time · material deviation
CNC and MetalworkingDowntime causes live in operators’ memory; efficiency cannot be compared per work order.
Availability · downtime Pareto · work order completion
Machine BuildingWork order progress is invisible on long processes; cost and performance per project are poorly tracked.
Production completion · time deviation per work order
General Discrete ManufacturingNo central view of which line or machine is in which state.
OEE · running / stopped machines · critical alerts
M01 Tuna Edge is the common foundation of every scenario where machine data is collected.These are representative scenarios derived from DDX evidence, not real customer case studies.

Beyond manufacturing: the same approach, other operations

Field ServiceVisibility of field technicians and service teams: first-time fix rate, SLA breach risk, travel and waiting inefficiency, spare-part use.
LogisticsFleet and route visibility: delivery success rate, delay causes, fuel consumption and deviation tracking.
Sales and MarketingSales team and pipeline visibility: quota attainment, loss-reason analysis, campaign spend deviation.
These three modules are a demo running on simulated data and, unlike the manufacturing scenarios, are not derived from DDX evidence.
Tuna Industrial Platform · 2026 / v112 / 15
Product and Service Cataloguecatalog.tunaindustrial.com
SERVICES

Four steps from assessment to a working factory

Our method starts with an independent DDX assessment, takes shape in a Solution Blueprint within 48-72 hours, and reaches the shop floor through a narrowly scoped pilot. Once the pilot succeeds, it grows on the same platform.

S01INDEPENDENT

DDX assessment

DDX is an independently run digital maturity assessment. It sets out the current state, the priority problems, and the target state.

OUTPUT Current state and priorities. Not a software specification.
S0248-72 HOURS

Solution Blueprint

The DDX output becomes a concrete document showing which modules are activated, with which integrations, which pilot scope, and on what timeline.

OUTPUT Module selection, integrations, pilot scope, timeline.
S031 AREA · 3-10 MACHINES

Narrow pilot

One production area, 3-10 machines, and a limited number of users. It can start soon after discovery and the connectivity review; the exact timing is set after discovery.

OUTPUT Modules running on the floor, with measurable success criteria.
S04SAME PLATFORM

Scale-up

Once the pilot criteria are met, scope extends to new lines, added capabilities such as quality and maintenance, or other plants. No setup from scratch.

OUTPUT New lines, new modules, new plants.

The DDX recommendation and the Tuna Industrial Platform commercial proposal are separate, traceable documents. Keeping them apart protects the independence of the assessment.

FIRST STEPSee where you stand before the assessment
Digital Transformation Scoretunaindustrial.com/en/digital-score
Tuna Industrial Platform · 2026 / v113 / 15
Product and Service Cataloguecatalog.tunaindustrial.com
WHERE TO START

Two starting points

Measure your plant’s digital maturity in a few minutes, or watch the modules in this catalogue running on simulated data.

THE 5 AREAS THE SCORE MEASURES
  1. 01Corporate Governance
  2. 02Customer & Market Management
  3. 03R&D Management
  4. 04Supply Management
  5. 05Production Management
START · ONLINE

Digital Transformation Score

Answer a short set of questions and get a maturity score across 5 areas with a roadmap tailored to you.

The score is generated automatically from your answers and is not a formal digital transformation audit.

START · TOGETHER

Live Factory Demo

We walk through the demo with you step by step, so you can see the modules in this catalogue working on one dashboard before any installation.

The demo runs on simulated factory data and is not a real customer installation.

Tuna Industrial Platform · 2026 / v114 / 15
Product and Service Cataloguecatalog.tunaindustrial.com
Tuna Industrial Platform
CONTACT

Making your factory visible starts with one assessment.

Tell us about your plant and what you want to improve. We will reply with the modules and pilot scope that fit your situation.

TURKEYTuna Project Global Ticaret A.Ş.Fuat Edip Baksı Mah. Anadolu Cad. No: 175/1 D:13, 35540 Bayraklı / İzmir+90 232 335 25 15info@tunaindustrial.com
UNITED STATESTuna Project LLC7901 4th St. N #16745, St. Petersburg, FL 33702, USA+1 908 444 6 888office@tunaindustrial.com
Figures in this catalogue are simulated demo data and do not represent a real customer result. Images are representative.Industry scenarios are representative examples derived from DDX evidence. Security controls are designed, not yet implemented.This catalogue is for information only and contains no pricing. Scope, timing, and commercial terms are defined in the Solution Blueprint.
© 2026 Tuna Industrial Platform · tunaindustrial.comcatalog.tunaindustrial.com · 2026 / v1
Tuna Industrial Platform · 2026 / v115 / 15